Understanding the Key Differences Between Gross Profit Margin and Net Profit Margin
Introduction: Profit margin is a fundamental metric used to assess the financial performance and profitability of a company. It measures the percentage of revenue that remains as profit after deducting various expenses. Profit margin consists of two main components: gross profit margin (GPM) and net profit margin (NPM). In this article, we will explore the concept of profit margin, delve into its subsections, and understand the differences between GPM and NPM, shedding light on their significance in evaluating a company’s financial health.
Profit Margin: Profit margin is a critical indicator of a company’s efficiency and profitability. It represents the proportion of revenue that remains as profit after accounting for all expenses. Expressed as a percentage, profit margin reflects a company’s ability to generate profit relative to its total revenue. It serves as a key benchmark for assessing financial performance and comparing companies across industries.
Gross Profit Margin (GPM): Gross profit margin is a profitability ratio that focuses on the relationship between revenue and the cost of goods sold (COGS). It measures the percentage of revenue remaining after deducting the direct costs associated with production or procurement. GPM provides insights into a company’s ability to generate profit from its core operations before accounting for operating expenses. It is calculated using the following formula:
Gross Profit Margin = (Revenue – COGS) / Revenue * 100
For instance, if a company has a GPM of 40%, it means that for every dollar of revenue, 40 cents are left as gross profit after covering the direct costs associated with production or procurement.
Net Profit Margin (NPM): Net profit margin takes into account all operating expenses, taxes, interest, and non-operational costs in addition to the COGS. It indicates the percentage of revenue that remains as profit after deducting all expenses. NPM provides a comprehensive view of a company’s profitability as it considers both direct and indirect costs. It is calculated using the following formula:
Net Profit Margin = (Net Profit / Revenue) * 100
NPM reflects the efficiency of the entire business, encompassing both operational and non-operational aspects. It reveals the impact of operating expenses, taxes, interest, and other costs on a company’s overall profitability.
Key Differences between GPM and NPM:
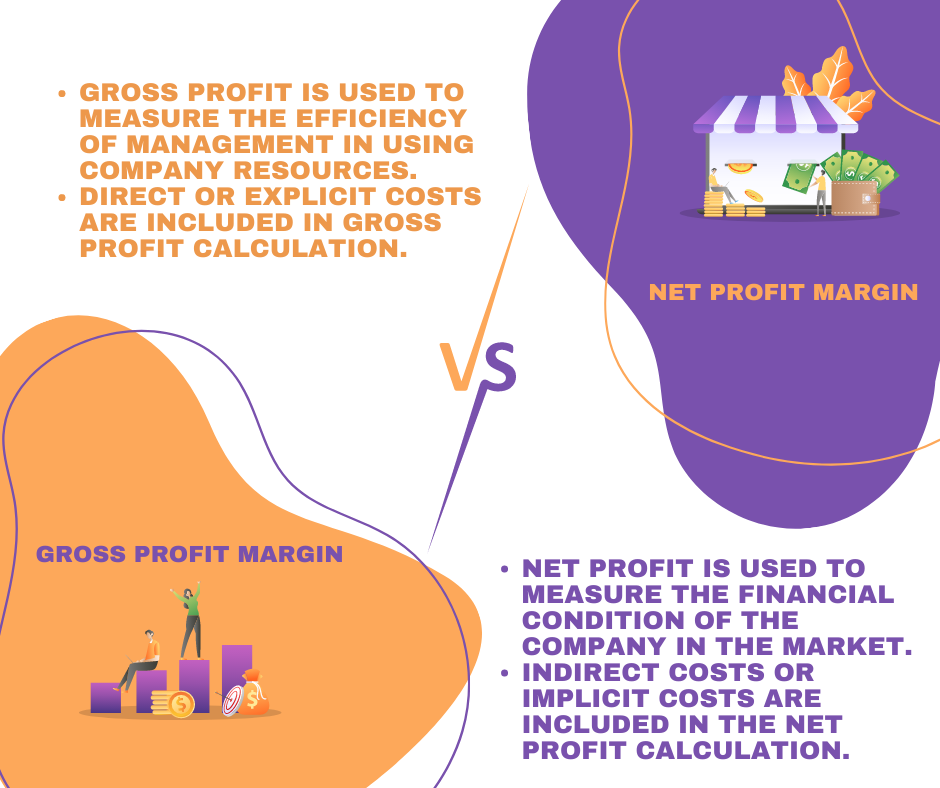
Scope of Expenses: GPM focuses solely on the direct costs associated with production or procurement, while NPM encompasses all operating expenses, taxes, interest, and non-operational costs.
Insights into Operations: GPM provides insights into a company’s operational efficiency and ability to generate profit from core activities, while NPM reflects the overall profitability after considering all expenses.
Comparisons: GPM is often used to compare companies within the same industry, assessing their relative ability to control production costs. NPM, on the other hand, is more suitable for cross-industry comparisons as it considers all expenses and provides a broader perspective on profitability.
Importance of Both Metrics: Both GPM and NPM play vital roles in evaluating a company’s financial performance.
GPM helps identify strengths and weaknesses in a company’s production or procurement processes. A declining GPM may indicate rising costs or pricing pressure, necessitating a closer examination of the company’s cost structure.
NPM provides a holistic view of a company’s profitability, taking into account all expenses. It helps investors and stakeholders assess the overall financial health and long-term sustainability of a business.
Conclusion: Profit margin serves as a crucial metric for evaluating a company’s profitability and efficiency. It consists of two main components: GPM and NPM. GPM focuses on core operations and direct costs, while NPM considers all expenses. By understanding and analyzing both metrics, investors and businesses can gain a deeper understanding of financial performance